Surfacing LoadMaster SSO User Logins in Flowmon Collector

This blog describes how you can use LoadMaster and Flowmon Collector to pair specific users with the corresponding network traffic and application transactions when investigating performance issues, to provide dashboards, reports, and alerts that keep you on top of application performance and assist in root cause analysis when investigating possible issues.
Exporting LoadMaster SSO Logs to Collector
A previous blog post described how Flowmon Collector and Kemp LoadMaster can be combined to provide user-specific application flow analysis through the export of LoadMaster logs to a Collector and by applying specific parsing rules on Collector to the incoming logs.
Once you follow the instructions in the blog post that appears in the first paragraph, you have:
- A LoadMaster with:
- At least one Virtual Service (VS) that is enabled for SSO
- Network Telemetry enabled and exporting flows to a Flowmon Collector
- Remote syslog enabled and exporting ESP user logs to the same Collector
- A Collector that is actively receiving ESP User logs from the above LoadMaster, with LoadMaster-specific parsing rules enabled for log analysis.
In this scenario, a LoadMaster (with the ESP package enabled) acts as a single sign-on (SSO) gateway for an application and handles user authentication through a third-party identity provider (such as Microsoft Active Directory). This puts the LoadMaster in a unique location in the application workload to provide user identity information to Flowmon Collector via syslog.
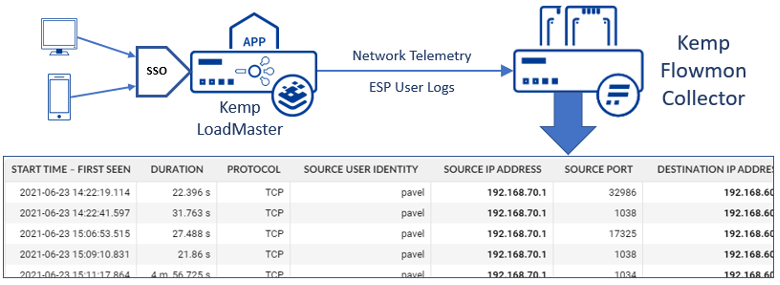
As shown in the partial screenshot above, the Collector can now automatically correlate User Identity information (such as Source User Identity, shown above) with network traffic flows collected from LoadMaster via Network Telemetry.
Dashboards and Reports Will Include User Identity
For example, you can now configure a widget that shows the user identities responsible for the highest level of network traffic, as in this example:
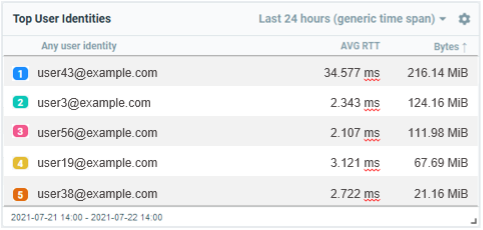
[Note that the user identity format that will be displayed depends on the way in which SSO is configured on the LoadMaster – specifically whether SSO is configured to use Principalname (as in the table above) or Username (as in the previous screenshot).]
To configure a widget for Top User Identities, you need to configure a Chapter to define the data you want to see in the widget and then create the widget. Do the following:
- Open the Collector UI Home page in your browser and click on Monitoring Center.
- Click on Reports at left, and then the Chapters tab.
- Click on +NEW CHAPTER and fill out the form that appears as follows:
- Type in a Name, such as “Top User Identities.”
- Type in a description, such as “Top 10 User Identities by Throughput (bytes).”
- Leave Profile, Channels, Type and Top set to their default values.
- Click on the drop-down for Base the statistics on the parameter and select User Identity > Source User Identity from the list.
- Click on one of the Chapter Columns set to none and select Average Round Trip Time (RTT) from the list.
- Leave Filter and Blacklist set to their defaults.
- If you have existing data on Collector, click on the Recompute drop-down and choose a time span; Collector will reanalyze data for the selected duration for the new chapter. Otherwise, the new “Top” chapter will be populated with data during the next hourly recompute interval.
- Click Save at the bottom of the form to create the new chapter.
- At the top of the Chapters screen, click Monitoring Center > Dashboards and Reports.
- Click on the tab for an existing dashboard, or create a new one by clicking the plus sign (+) to the right of the last dashboard tab.
- Click the New Widget button at the bottom of the dashboard. Fill out the form as follows:
- Leave Category set to the default.
- Click the Data to display drop-down and select the Name of the chapter you created above in Step 3a.
- Click Create Widget. The dashboard is now displayed with the widget you just configured. If you recomputed data for the widget above in Step 3g, you should see data in the widget when it appears.
Drilling Down on an Issue Observed in the Widget
Looking at the data in the sample widget above, it looks like the user consuming the most bandwidth is also having latency issues. Since this widget aggregates data for the top user identities, you can’t tell when and for how long this user has had issues. To drill down further into the data:
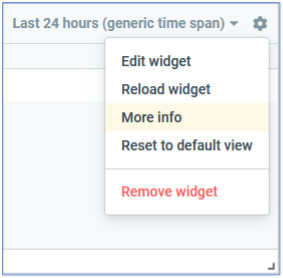
- Click on the cog icon at the top right of the widget and select More Info.
- The Monitoring Center opens with:
- The top of the screen displaying the traffic data for the duration that was selected for the widget (by default, 24 hours as in the screen shot above).
- The Advanced Analysis section at bottom displaying the same data as in the widget table, with more columns to show additional aggregate data.
- To see the entire list of flows relevant to the same data window in the Advanced Analysis sectioninstead of the aggregate data:
- Click the Data Flows tab.
- Click Process.
Additional custom analysis can be performed using the controls on this page.
Alerting on a Specific User Identity
Let’s say you want to alert on a specific user identity when that user consumes more than a specific amount of bandwidth over time. You can use the same chapter we created above to create the widget to do that as well. To create such an alert, do the following:
- Click Monitoring Center > Alerts > +New Alert.
- Fill out the top of the form as shown in the example below:
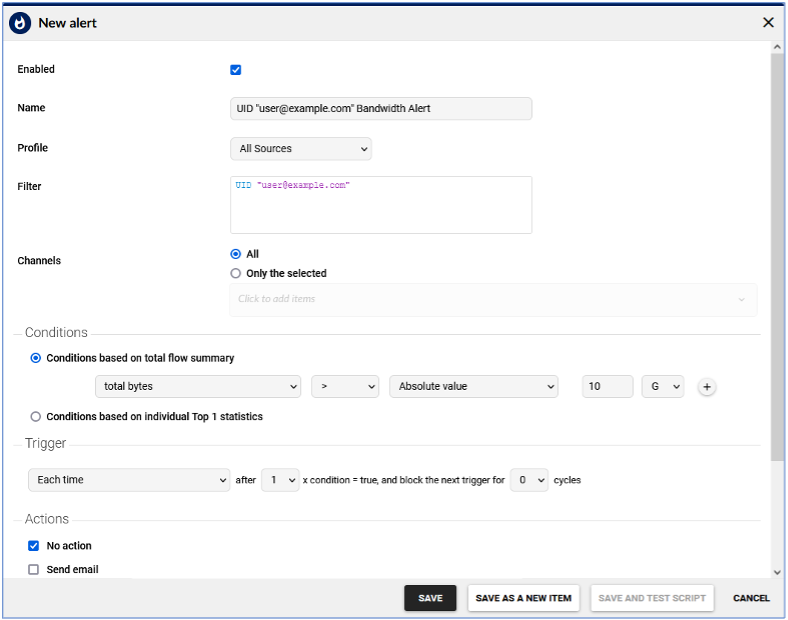
Note that you should change the Name and Filter to reflect the actual user identity instead of user@example.com.
- At the bottom of the form, under Actions, click on one or more of the actions available: Send email, Run script, Send a syslog, or Send SNMP trap.
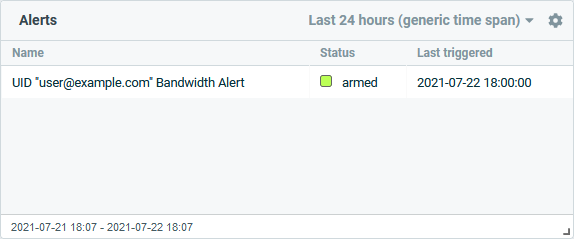
Now add an Alert widget to one of your Dashboards so you can monitor your new alert without going to the Monitoring Center alert screen.
- Click Dashboards and Reports and open one of your existing Dashboards.
- Click New Widget at the bottom of the screen (scroll down if necessary).
- Click the Data to Display drop-down and (at the bottom of the list) click on Alerts.
- Click Create Widget. The result should look like the screenshot below.
Adding the New Chapter to a Report
Finally, the same chapter used above to create the widget can be added to a Report, which can also be scheduled for creation and delivery on a periodic basis.
- Click Dashboards and Reports > Reports.
- Click … at the right of an existing report and select Edit. (Or create a new report by clicking New Report).
- Click Add Chapter at the bottom of the screen (you may need to scroll down if there are existing chapters in the report).
- Select the chapters to add to the report from the menu and click Add to Report.
- Click Save Report.
- To schedule a report, click … at the right of an existing report and select Schedule.
- Select appropriate options in the New Schedule form and then click Add Schedule.
Note that an email configuration must be defined in the Configuration Center under System > System Settings > Email before reports will be delivered.
Drilling Down to User Identity from Standard Widgets
So far, we’ve talked about adding specific widgets and alerts using user identity. Once correlation of syslog and flow information is enabled, you can also drill down to user identity information from any widget or alert that you create.
Let’s say you’re looking at the default Top Hostnames widget, which looks like this:
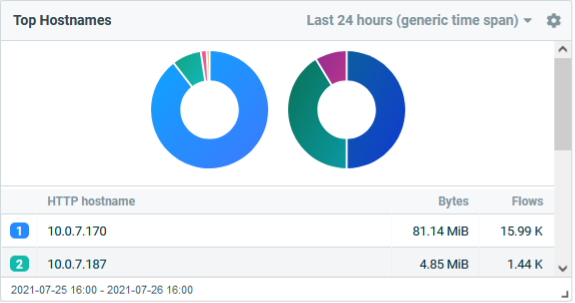
If you’re interested in seeing the User Identity information (if any) associated with the flows that are represented in this widget, you can click the cog icon at the upper right of the widget and click More Info to open an analysisscreen using this data. Once the screen is open:
- Scroll down the screen to the Advanced Analysis section.
- Click the List of Flows tab.
- In the Aggregate drop-down, select User Identity > Source user identity.
- Enable the Sort by checkbox and select bytes.
- In the Output drop-down, select User Identity.
- Click on Filter and type the following into the text box:
src uid
- Click the Process button.
The table of flows is replaced with one that includes the source user identity associated with each flow, as in this example:

Addendum to Previous Blog
The previous blog post on integrating ESP logs into Collector demonstrated adding one rule to Flowmon Collector under Configuration Center > System > System Settings > Syslog Server that scans for SSO client login and client logout events. This rule assumed that the LoadMaster was using the standard syslog-format for ESP user logs.
The rule in the table below is an equivalent rule that can be used when Common Event Format (CEF) logs are enabled for ESP on LoadMaster. The Use CEF Log Format option is disabled by default and appears on the System Administration > Miscellaneous Options > L7 Configuration UI page. If you have CEF log format enabled on LoadMaster, use the rule below instead of the rule from the previous blog.
| Name | Login Rule | Logout Rule |
| Kemp User Identity | @ESTRING::User @@ESTRING:USERNAME: logged on from @@ESTRING:ASSIGNED_IP:@ | @ESTRING::user=@@ESTRING::\@@ESTRING:USERNAME: @@ESTRING::Deleted expired user session@ |
If you encounter any problems in the functioning of the script, let us know. We’ll be happy to help.

Mark Hoffmann
Mark Hoffmann is a Product Manager at Kemp. Previously, he worked at Fortinet and Coyote Point Systems on their ADC product lines. Before that, he spent more years than he cares to remember working in diverse roles on various flavors of Unix/Linux operation systems. Mark holds a BS in Computer Science from the State University of New York and currently lives in upstate New York. Mark is the primary responder on the Kemp Ideas Portal (https://ideas.kemp.ax/). Kemp is committed to constant improvement and to seeking out new ideas and directions for improving the functionality and quality of our products. If you have an idea that you want to tell Mark about, stop by the Ideas Portal and start a conversation!
more from the authorRelated tags
Explore more articles
Kemp is part of the Progress product portfolio. Progress is the leading provider of application development and digital experience technologies.
Copyright © 2026 Progress Software Corporation and/or its subsidiaries or affiliates. All Rights Reserved.
Progress and certain product names used herein are trademarks or registered trademarks of Progress Software Corporation and/or one of its subsidiaries or affiliates in the U.S. and/or other countries. See Trademarks for appropriate markings. All rights in any other trademarks contained herein are reserved by their respective owners and their inclusion does not imply an endorsement, affiliation, or sponsorship as between Progress and the respective owners.