Getting Started with LoadMaster Network Telemetry

Network Telemetry in LMOS 7.2.53 provides the traffic visibility you need to stay on top of network events.
Getting Started with LoadMaster Network Telemetry
Today, Kemp is excited to announce the introduction of Network Telemetry with Load Balancing as a key feature in the LoadMaster product family.
As a Product Manager at Kemp, I hear from LoadMaster customers about the things that keep them up at night. Like application performance and security. Application providers want to be able to understand how their clients experience the services they offer through LoadMaster and be able to assess that experience across complex network configurations.
LoadMaster has a central role in providing a positive application experience for clients accessing the applications hosted behind it. While LoadMaster offers traditional telemetry tools like access to system information via SNMP (the Simple Network Management Protocol) and packet captures taken by the Loadmaster. Some customers have requested the ability to export the entire application traffic stream via one of its network ports for central collection and analysis.
With the addition of Network Telemetry via the Flowmon Probe on LoadMaster, Kemp now makes available to its LoadMaster customers the power of the Flowmon Probe and Collector to fill this need.
LoadMaster + Flowmon = Powerful Modern Network Telemetry
What’s Network Telemetry?
Network Telemetry is statistical data generated from analysis of the traffic in your network. Many of us are already familiar with the network data we can access via facilities. These include SNMP (Simple Network Management Protocol) and packet capture tools (like WireShark). Leveraging both can give you a lot of detailed information about your network.
The problems come with the “a lot” and “detailed” bits of that statement above. Analyzing all that detailed data is time-consuming and requires lots of data storage. Modern network telemetry data, on the other hand, is generated based on the underlying data transfers abstracted from packets. The subject of the communication itself as distilled from the traffic (packet payloads are not stored). These statistics represent the flow data in the network, which can be thought of like a list of telephone calls. From this we can gain an understanding of who communicates with whom, when, how long, and how often.
Why Flowmon Probe?
The Flowmon Probe on LoadMaster examines the traffic flowing through LoadMaster and extracts data such as IP addresses, data volumes, time, ports, and protocols. Along with latency measurements and application layer data for a variety of protocols.
When a request from a client to the server, the probe looks into the packet header and creates a flow record.The flow record contains information about the source & destination IP addresses and ports, protocol number, number of bytes and packets, and all other information from layer 3 and 4. Individual data network communications are identified by source & destination IP addresses, ports, and protocol number.
When the server responds to the client, IP addresses and ports in the packet header are reversed and another flow record is created. Subsequent packets with the same attributes update the previously created flow records (e.g.: number of bytes, duration of communication). When the communication is over, flow records are then exported for further analysis.
Why Flowmon Probe on LoadMaster?
LoadMaster Network Telemetry improves both your visibility into network performance and security as well as your ability to respond to customer needs and security issues before they become a problem. This applies whether you have a network telemetry appliance on your network already or not:
- LoadMaster Network Telemetry delivers data from an existing node in your network (i.e., LoadMaster) that provides application-specific knowledge at no extra cost.
- For an existing telemetry-enabled network, adding a LoadMaster with Network Telemetry provides an additional intelligent point of triangulation at no extra cost.
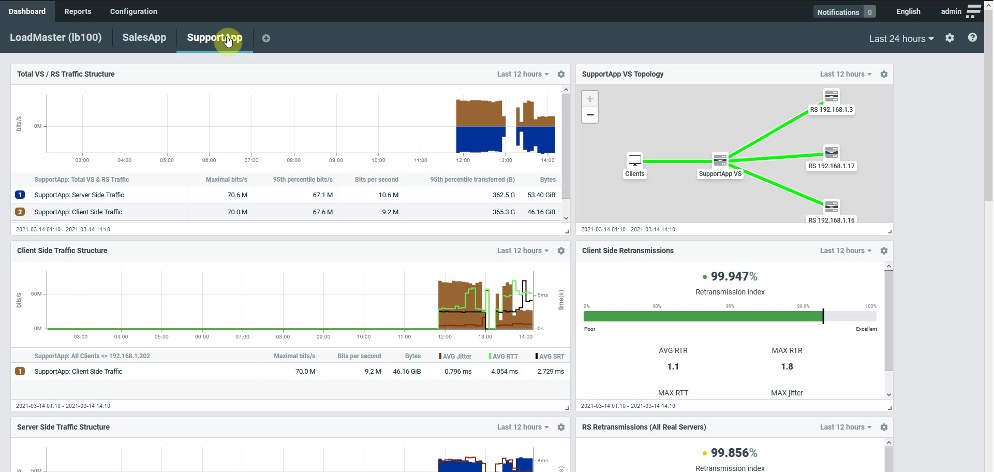
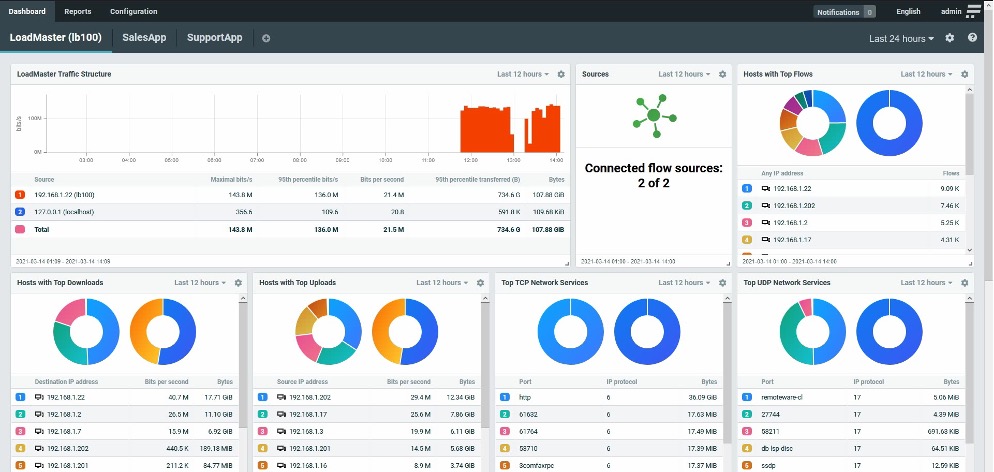
Why Flowmon Collector?
The Flowmon Collector, as shown above, can be completely customized to reflect your LoadMaster application estate. Combined dashboards that describe the overall traffic flow through LoadMaster as well as Virtual Service specific dashboards that focus on specific applications. Collector opens up an entirely new dimension of actionable insights:
- Detect anomalies such as unresponsive services and raise alerts.
- Assess encrypted traffic to simplify the enforcement of security policies.
- Identify top bandwidth consumers to save budget on infrastructure.
- Monitor latency of SaaS applications such as Office 365, Salesforce, and Google Apps.
- Track user experience, identify bottlenecks, and correct latency issues.
- Report on service degradation that may impact mission-critical operations.
- Track historical data to learn about trends and make proactive decisions.
- Provide meaningful cross-platform visibility into hybrid environments.
How Do I Get Started?
Get a trial version of LoadMaster and install it (or, upgrade to LMOS 7.2.53 or above).
- Open the Network Telemetry menu.
- Download a trial Flowmon Collector. After downloading the Collector, you can also download the LoadMaster Dashboards for Collector script.
- Install Flowmon Collector (full installation instructions are included in the download).
- Configure LoadMaster to export data to the installed Collector on the Network Telemetry UI page.
- Refer to the LoadMaster Dashboards for Collector script documentation for how to configure and run the script to create LoadMaster-specific dashboards on Collector.

Mark Hoffmann
Mark Hoffmann is a Product Manager at Kemp. Previously, he worked at Fortinet and Coyote Point Systems on their ADC product lines. Before that, he spent more years than he cares to remember working in diverse roles on various flavors of Unix/Linux operation systems. Mark holds a BS in Computer Science from the State University of New York and currently lives in upstate New York. Mark is the primary responder on the Kemp Ideas Portal (https://ideas.kemp.ax/). Kemp is committed to constant improvement and to seeking out new ideas and directions for improving the functionality and quality of our products. If you have an idea that you want to tell Mark about, stop by the Ideas Portal and start a conversation!
more from the authorExplore more articles
Kemp is part of the Progress product portfolio. Progress is the leading provider of application development and digital experience technologies.
Copyright © 2026 Progress Software Corporation and/or its subsidiaries or affiliates. All Rights Reserved.
Progress and certain product names used herein are trademarks or registered trademarks of Progress Software Corporation and/or one of its subsidiaries or affiliates in the U.S. and/or other countries. See Trademarks for appropriate markings. All rights in any other trademarks contained herein are reserved by their respective owners and their inclusion does not imply an endorsement, affiliation, or sponsorship as between Progress and the respective owners.