Progress LoadMaster 360 User Insights: A New Tool for Optimizing the Application Experience

Application delivery is inherently complex. Modern applications rely on various virtual and hardware resources distributed across a diverse IT landscape. Given the different components and services involved, organizations must invest considerable time and resources to maintain high application availability and performance.
IT teams such as DevOps, IT ops and site reliability engineers (SREs) are all involved in maintaining the application experience. Most of these teams use different tools to gain visibility into the application delivery chain and maximize the application availability, performance and security. This poses a transparency problem. Without centralized management, these tools create data silos that are difficult to correlate and analyze, which in turn impacts visibility and compromises application performance and security.
In this blog post, we discuss how the Progress LoadMaster 360 Application Analytics and Telemetry features offer the insights necessary to optimize application delivery, helping you to realize the best possible application experience for your users.
Application Delivery Is Complicated
The application delivery chain involves multiple services and solutions. The performance and health of each component determine the application experience so your ability to track performance metrics and analyze data is crucial. However, it can be cumbersome to constantly monitor a complex application delivery chain for performance and security-related issues.
Even worse, when IT teams use multiple monitoring and observability tools, everyone has their own “source of truth.” These tools may require product expertise and may depend on other third-party solutions to collect and parse information in a customized solution. In such scenarios, application analytics data from different sources usually fails to give a holistic understanding of application health and security posture.
For a more seamless delivery experience, application owners need end-to-end visibility into the application delivery chain to determine actionable insights. This is possible by consolidating relevant application data, grouping the different components and correlating and visualizing the information in a unified console.
That’s why we created LoadMaster 360. It is an easy-to-access SaaS tool that provides admins and application owners with a consolidated dashboard focused on the applications your LoadMaster fleet serves. You can now work in sync with other IT teams! While this blog will focus on Application Analytics and Telemetry, you should know that LoadMaster 360 offers:
- Application and device telemetry with in-depth dashboards and custom reports to monitor application performance, health and security.
- An Incident Center to manage issues when they occur with context-rich internal and external critical alerts for a timely response.
- Certificate lifecycle management to gain insights into your certificate estate and help prevent outages by receiving notifications on expiring certificates.
- Advanced WAF capabilities with AI-driven false positive identification and smart rule tuning to secure the application delivery chain.
- Authentication management for a unified view of authentication efforts across all applications and authentication providers.
Granular Analysis with LoadMaster 360 User Insights
IT teams managing multiple load balancers deployed across different environments have limited visibility into application performance. Application data such as request type, server response time, SSL details, device information, etc., are key indicators of application health. However, this data may not be easily available to application owners who depend on third-party solutions to find the necessary information.
LoadMaster 360 Application Analytics and Telemetry offers a curated view of application performance data with specialized insights for each application you are load balancing. This includes:
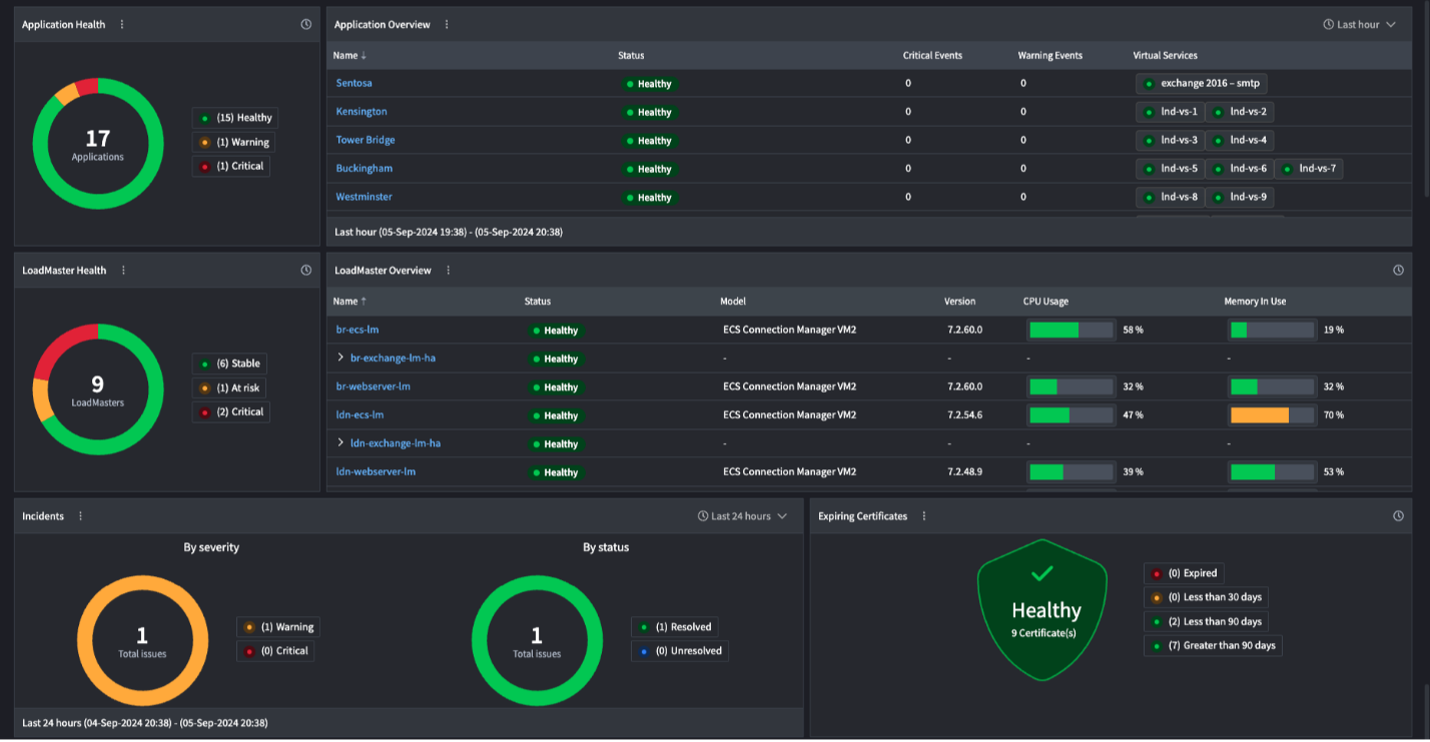
- Customizable dashboards for complete visibility into the application delivery chain with key metrics including load balancer health and performance, application loads and status and security events.
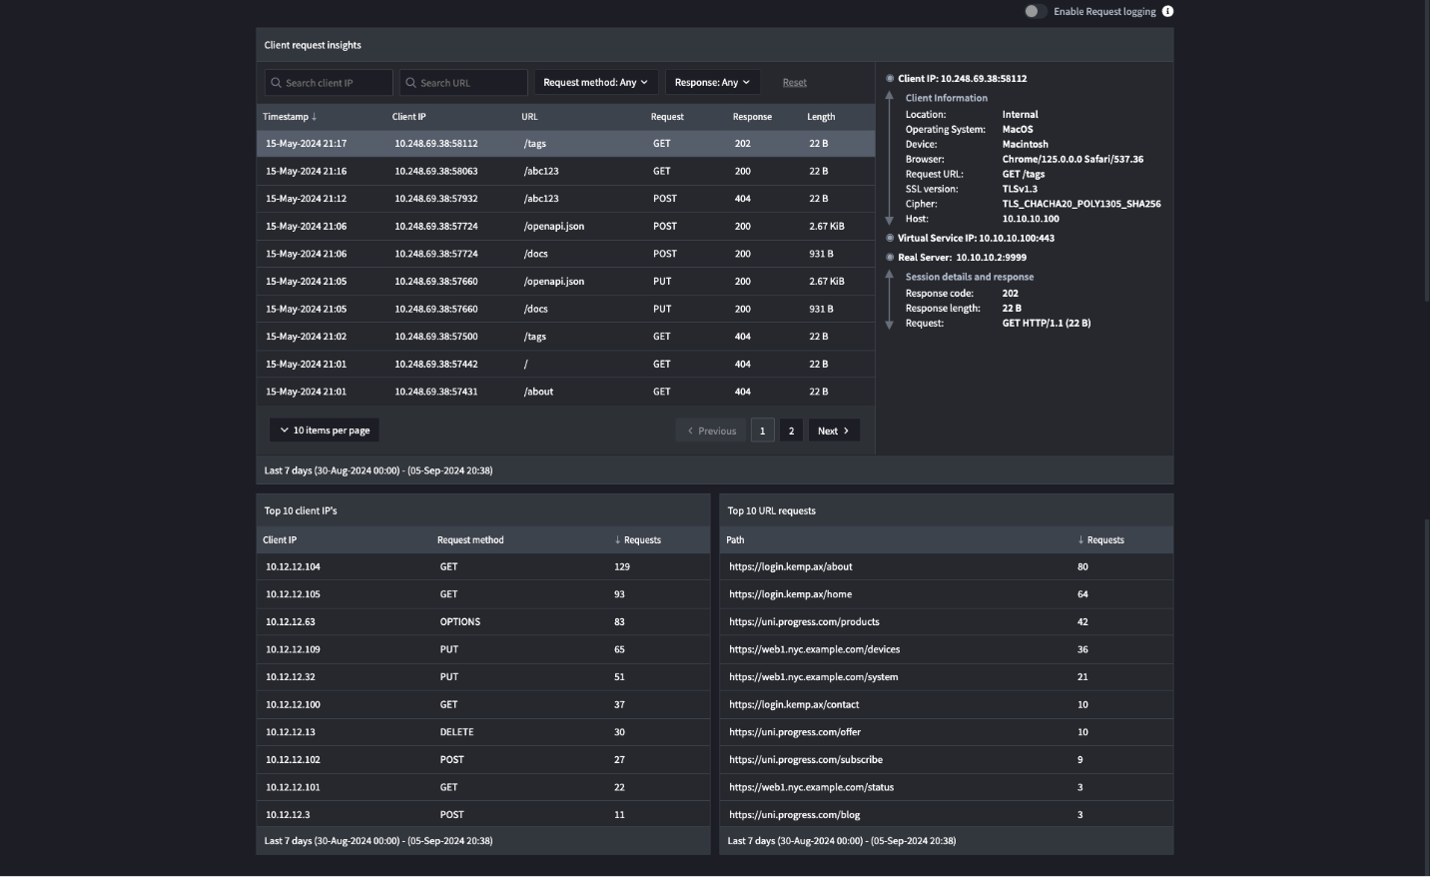
- Actionable insights from real-time network and application data including device/browser type, SSL version, SSL ciphers, server IPs, session IDs and more. In-depth request/response details to understand client-to-application timings, request type and server response times.
- Alerts on application status, client request insights and security posture that help to mitigate issues. The integrated incident management feature notifies the right teams about potential application performance and availability issues.
As of release 1.2, the User Insights feature further enhances visibility into critical components in the application delivery chain. User Insights provides greater visibility and granular data at the individual application request level. You can examine in-depth client requests and connection insights and connector status information for LoadMaster 360. You can view:
- Client Connections: Map external connections in a global map view (figure below) to see where connections originate from and to understand the geographic reach of the application traffic.
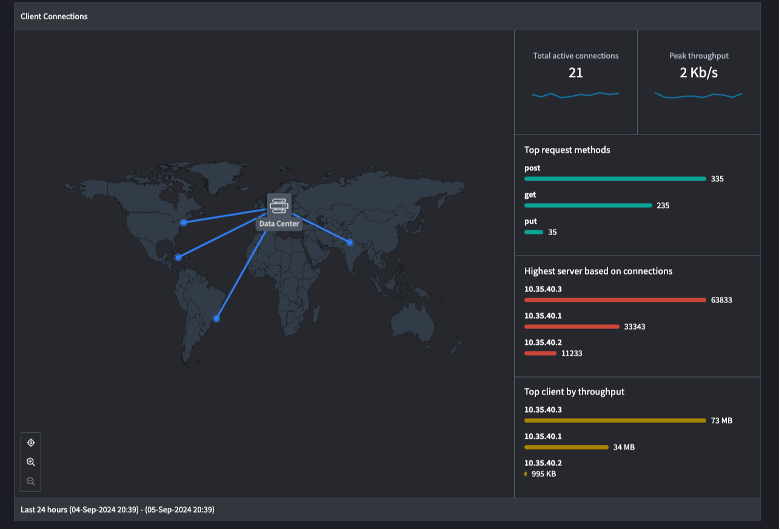
- Top HTTP Request Methods: Gain visibility into the most-used HTTP methods to track normal user behavior.
- Top Servers by Connections: Identify the servers handling the most connections, enabling optimized resource allocation.
- Top Clients by Throughput: Get an understanding of your top users to be aware of expected vs potential threats.
Improve Application Experience with User Insights
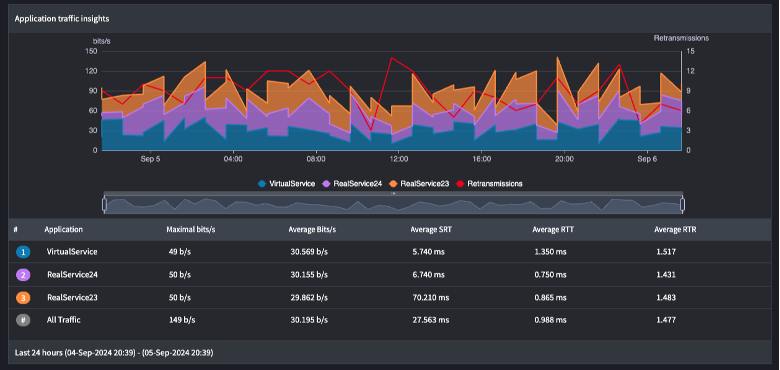
LoadMaster 360 can significantly impact the Mean Time to Resolution (MTTR) with its easy access to relevant application data and actionable insights. For example, application traffic insights provide a snapshot of the traffic distribution across load-balanced applications, making it easier to identify unusual traffic patterns, such as a sudden increase in traffic to a specific application, which could indicate a potential security issue. LoadMaster 360 assists in determining the root cause by providing key information about your applications and traffic profile.
Similarly, tracking performance metrics such as Round Trip Time (RTT) and Server Response Time (SRT) can identify latency in the application delivery chain. Since each application is mapped to specific virtual services, you can identify bottlenecks in the delivery chain and analyze how each virtual service impacts the overall application experience.
The detailed and granular data from User Insights can be used to optimize application delivery and maintain highly available and responsive applications. With LoadMaster 360 User Insights, you can optimize application delivery, achieve faster time to value and mitigate security issues.
Learn More About User Insights
LoadMaster 360 release 1.2 with advanced User Insights capabilities is now available. For additional details, visit the feature web page.
.jpg?sfvrsn=98fc73aa_1 "814A2086-copy-1 (1)")
Kameerath Abdul Kareem
Kameerath is a Product Marketing Manager at Progress, overseeing the Kemp LoadMaster portfolio. With a background in diverse IT areas such as cloud computing, DevSecOps, IT Ops and APM, she has a passion for writing about all things tech.
more from the author
Related tags
Explore more articles
Kemp is part of the Progress product portfolio. Progress is the leading provider of application development and digital experience technologies.
Copyright © 2026 Progress Software Corporation and/or its subsidiaries or affiliates. All Rights Reserved.
Progress and certain product names used herein are trademarks or registered trademarks of Progress Software Corporation and/or one of its subsidiaries or affiliates in the U.S. and/or other countries. See Trademarks for appropriate markings. All rights in any other trademarks contained herein are reserved by their respective owners and their inclusion does not imply an endorsement, affiliation, or sponsorship as between Progress and the respective owners.