A, B, C, D, E(LK) plus LM WAF Equals stunning visualization!

This blog will run through creating dashboards in the ELK (Elasticsearch, Logstash, Kibana) Stack to gain further insight into the LoadMaster WAF (Web Application Firewall).
ELK Stack
The ELK Stack is a standalone search and analytics engine:
- Elasticsearch is the search and analytics engine at the heart of the Elastic Stack
- Logstash facilitates collecting and aggregating the data into Elasticsearch
- Kibana enables the exploration and visualization of the data
The Kemp Technologies LoadMaster integration with Elasticsearch is simple and easy to achieve with Logstash. The Kemp WAF provides syslog outputs that are easily consumed and parsed by Elasticsearch to enhance visibility (via Kibana) of whom is connecting to your application via the LoadMaster and to their intentions.
LoadMaster settings
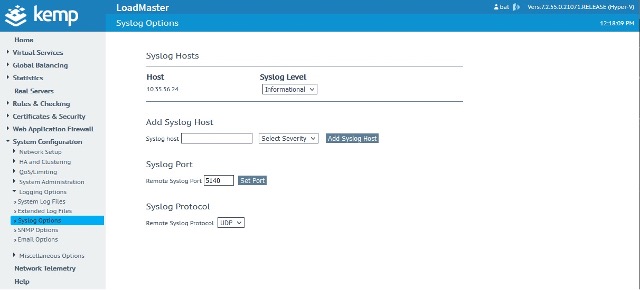
In the LoadMaster Syslog Options, we are sending the syslog outputs to the Logstash server, as shown in Figure 1.
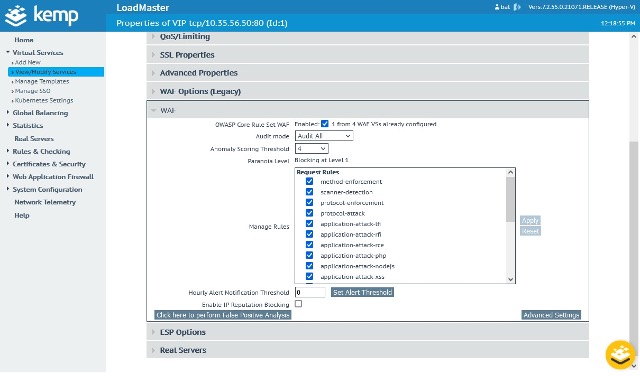
The LoadMaster WAF is configured as shown in Figure 2. [This is not a recommended configuration for the LoadMaster WAF, purely to aid visualization within ELK that rules are triggered.]
ELK – Logstash
I am running Logstash on an Ubuntu server (IP 10.35.56.24), where is it accepting syslog events from the LoadMaster on port 5140. Once received, it is parsing those syslog events and sending them to a cloud-based ELK stack.
This parser will run on all LoadMaster syslog events and may return a grok error in some cases. This is acceptable for the purposes of the blog to demonstrate the LoadMaster WAF visualization capabilities.
input {
tcp {
port => 5140
type => syslog
id => "loadmaster_syslog_tcp"
}
udp {
port => 5140
type => syslog
id => "loadmaster_syslog_udp"
}
}
filter {
# Extract event time, log severity level, source of attack (client), and the alert message.
grok {
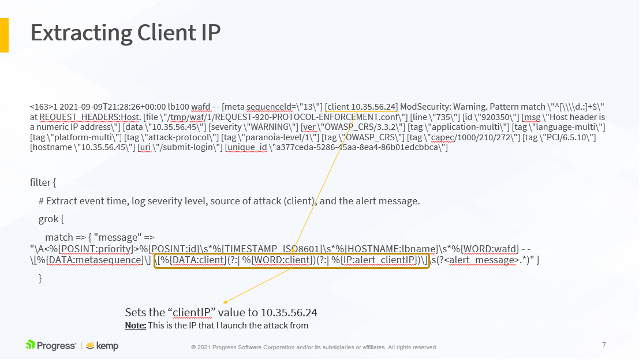
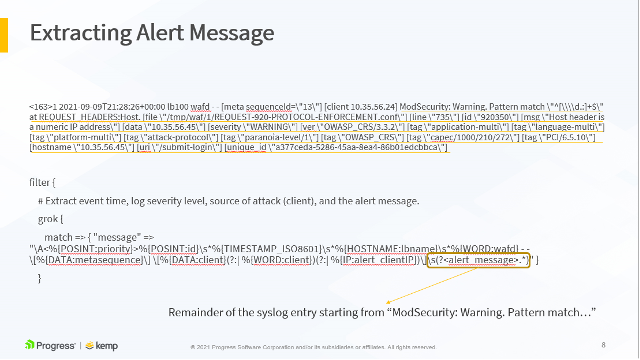
match => { "message" => "\A<%{POSINT:priority}>%{POSINT:id}\s*%{TIMESTAMP_ISO8601}\s*%{HOSTNAME:lbname}\s*%{WORD:wafd} - - \[%{DATA:metasequence}\] \[%{DATA:client}(?:| %{WORD:client})(?:| %{IP:alert_clientIP})\]\s(?<alert_message>.*)" }
}
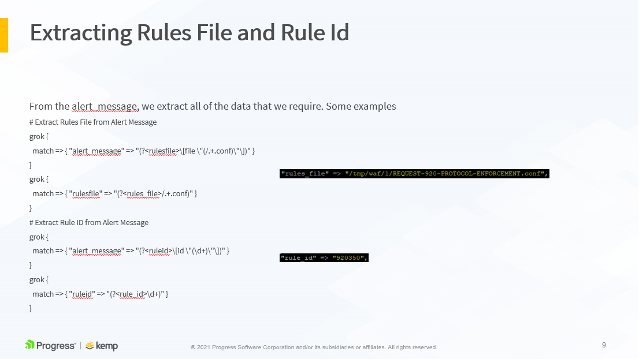
# Extract Rules File from Alert Message
grok {
match => { "alert_message" => "(?<rulesfile>\[file \"(/.+.conf)\"\])" }
}
grok {
match => { "rulesfile" => "(?<rules_file>/.+.conf)" }
}
# Extract Rule ID from Alert Message
grok {
match => { "alert_message" => "(?<ruleid>\[id \"(\d+)\"\])" }
}
grok {
match => { "ruleid" => "(?<rule_id>\d+)" }
}
# Extract Attack Message (msg) from Alert Message
grok {
match => { "alert_message" => "(?<msg>\[msg \S(.*?)\"\])" }
}
grok {
match => { "msg" => "(?<alert_msg>\"(.*?)\")" }
}
# Extract Severity from Alert Message
grok {
match => { "alert_message" => "(?<severity>\[severity \S(.*?)\"\])" }
}
grok {
match => { "severity" => "(?<alert_severity>\"(.*?)\")" }
}
# Extract Unique Id from Alert Message
grok {
match => { "alert_message" => "(?<unique_id>\[unique_id \S(.*?)\"\])" }
}
grok {
match => { "unique_id" => "(?<alert_unique_id>\"(.*?)\")" }
}
grok {
match => { "alert_message" => "(?<matched_data>(Matched Data:+.+))\"\]\s\[severity" }
}
#
# Newly Added
#
# Extract Attack Type from Rules File
grok {
match => { "rulesfile" => "(?<attack_type>[A-Z]+-[A-Z][^.]+)" }
}
# Extract the User/Scanner Agent from Alert Message
# grok {
# match => { "alert_message" => "(?<scanner>User-Agent' \SValue: `(.*?)')" }
# }
# grok {
# match => { "scanner" => "(?<user_agent>:(.*?)\')" }
# }
# grok {
# match => { "alert_message" => "(?<agent>User-Agent: (.*?)\')" }
# }
# grok {
# match => { "agent" => "(?<user_agent>: (.*?)\')" }
# }
# Extract the Target Host
grok {
match => { "alert_message" => "(hostname \"%{IPORHOST:alert_vip})" }
}
# Extract the Request URI
grok {
match => { "alert_message" => "(uri \"%{URIPATH:request_uri})" }
}
grok {
match => { "alert_message" => "(?<ref>referer: (.*))" }
}
grok {
match => { "ref" => "(?<referer> (.*))" }
}
mutate {
# Remove unnecessary characters from the fields.
gsub => [
"alert_msg", "[\"]", "",
"alert_severity", "[\"]", "",
"alert_unique_id", "[\"]", "",
"user_agent", "[:\"'`]", "",
"user_agent", "^\s*", "",
"referer", "^\s*", ""
]
# Remove the Unnecessary fields so we can only remain with
# General message, rules_file, attack_type, rule_id, alert_msg.
remove_field => [ "alert_message", "rulesfile", "ruleid", "msg", "severity", "unique_id", "scanner", "agent", "ref" ]
}
}
output {
elasticsearch {
hosts => ["https://loadmaster-abcde.com:9243"]
user => "elastic"
password => "abcdelkplusLMWAF"
ecs_compatibility => v1
index => "loadmaster"
}
stdout { codec => rubydebug }
}The following slides show an example LoadMaster WAF syslog output and how it maps to the LogStash configuration above. This is further detailed in the accompanying video, available here.
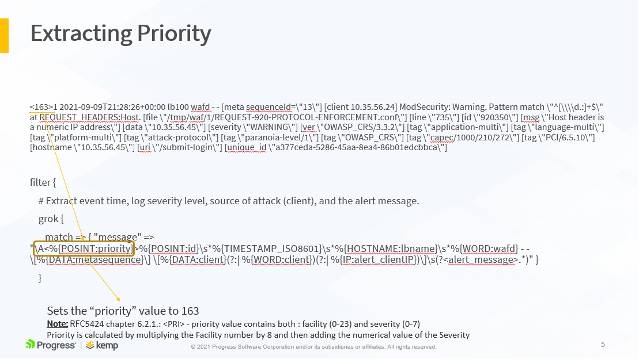
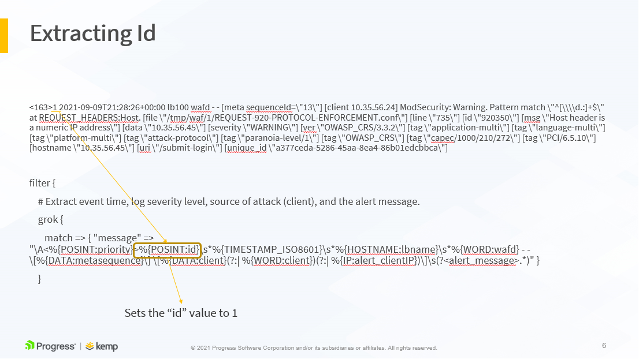
All these parameters are extracted to their own variables and sent to the ELK stack. This allows us to build stunning visualizations based on these variables.
ELK – Kibana
Now that I have WAF enabled on the Virtual Service and LogStash receiving, parsing, and forwarding events, I start to receive those parsed syslog events in Kibana as shown in Figure 8.
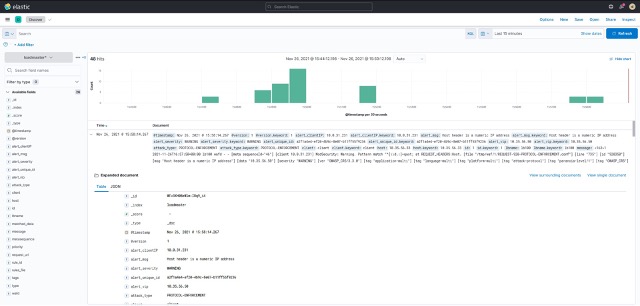
LogStash has parsed the LoadMaster WAF syslog messages and we can see that it has extracted the Client IP, Virtual Service IP, ModSecurity message / severity / unique IP / attack type etc. fields. With this information available, we can use Kibana to build visualizations as shown in Figure 9.
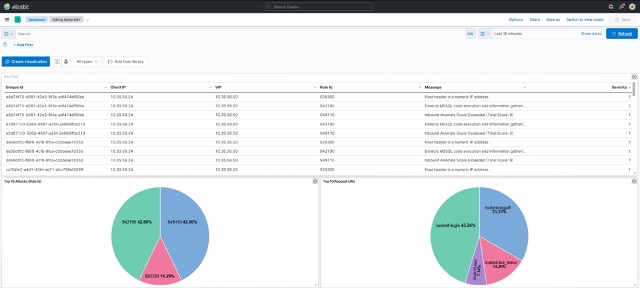
My visualizations are a bit more basic, I’m sure that you can do better!!! ?
All the necessary information is there to gain the required levels of insight into the LoadMaster WAF operation. Please see the accompanying video for a live demonstration of this in operation, below. To try things yourself, why not download a LoadMaster trial here and setup your elastic cloud trial here
References
Create Kibana virtualization dashboards for modsecurity logsProcess and visualize modsecurity logs on ELK stack
Download the free trial

David O'Connor
David O’Connor is a Product Manager in Kemp working in Limerick, Ireland. He holds a bachelor’s degree in Computer Engineering from University of Limerick. David has a telecoms background with previous roles in development, customer support and presales with a focus on product-market fit and creating tech products that customers love.
more from the authorRelated tags
Explore more articles
Kemp is part of the Progress product portfolio. Progress is the leading provider of application development and digital experience technologies.
Copyright © 2026 Progress Software Corporation and/or its subsidiaries or affiliates. All Rights Reserved.
Progress and certain product names used herein are trademarks or registered trademarks of Progress Software Corporation and/or one of its subsidiaries or affiliates in the U.S. and/or other countries. See Trademarks for appropriate markings. All rights in any other trademarks contained herein are reserved by their respective owners and their inclusion does not imply an endorsement, affiliation, or sponsorship as between Progress and the respective owners.